Understanding AI-Powered Workflow Dashboards
First things first, what exactly are these AI-powered workflow dashboards we're talking about? Think of a traditional dashboard, like the one in your car, showing speed and fuel. Now, imagine that dashboard not only showing current status but also analyzing patterns, predicting potential engine trouble based on subtle vibrations, and suggesting the most fuel-efficient route based on real-time traffic AI. That's the essence of an AI workflow dashboard – it takes raw operational data and infuses it with intelligence.
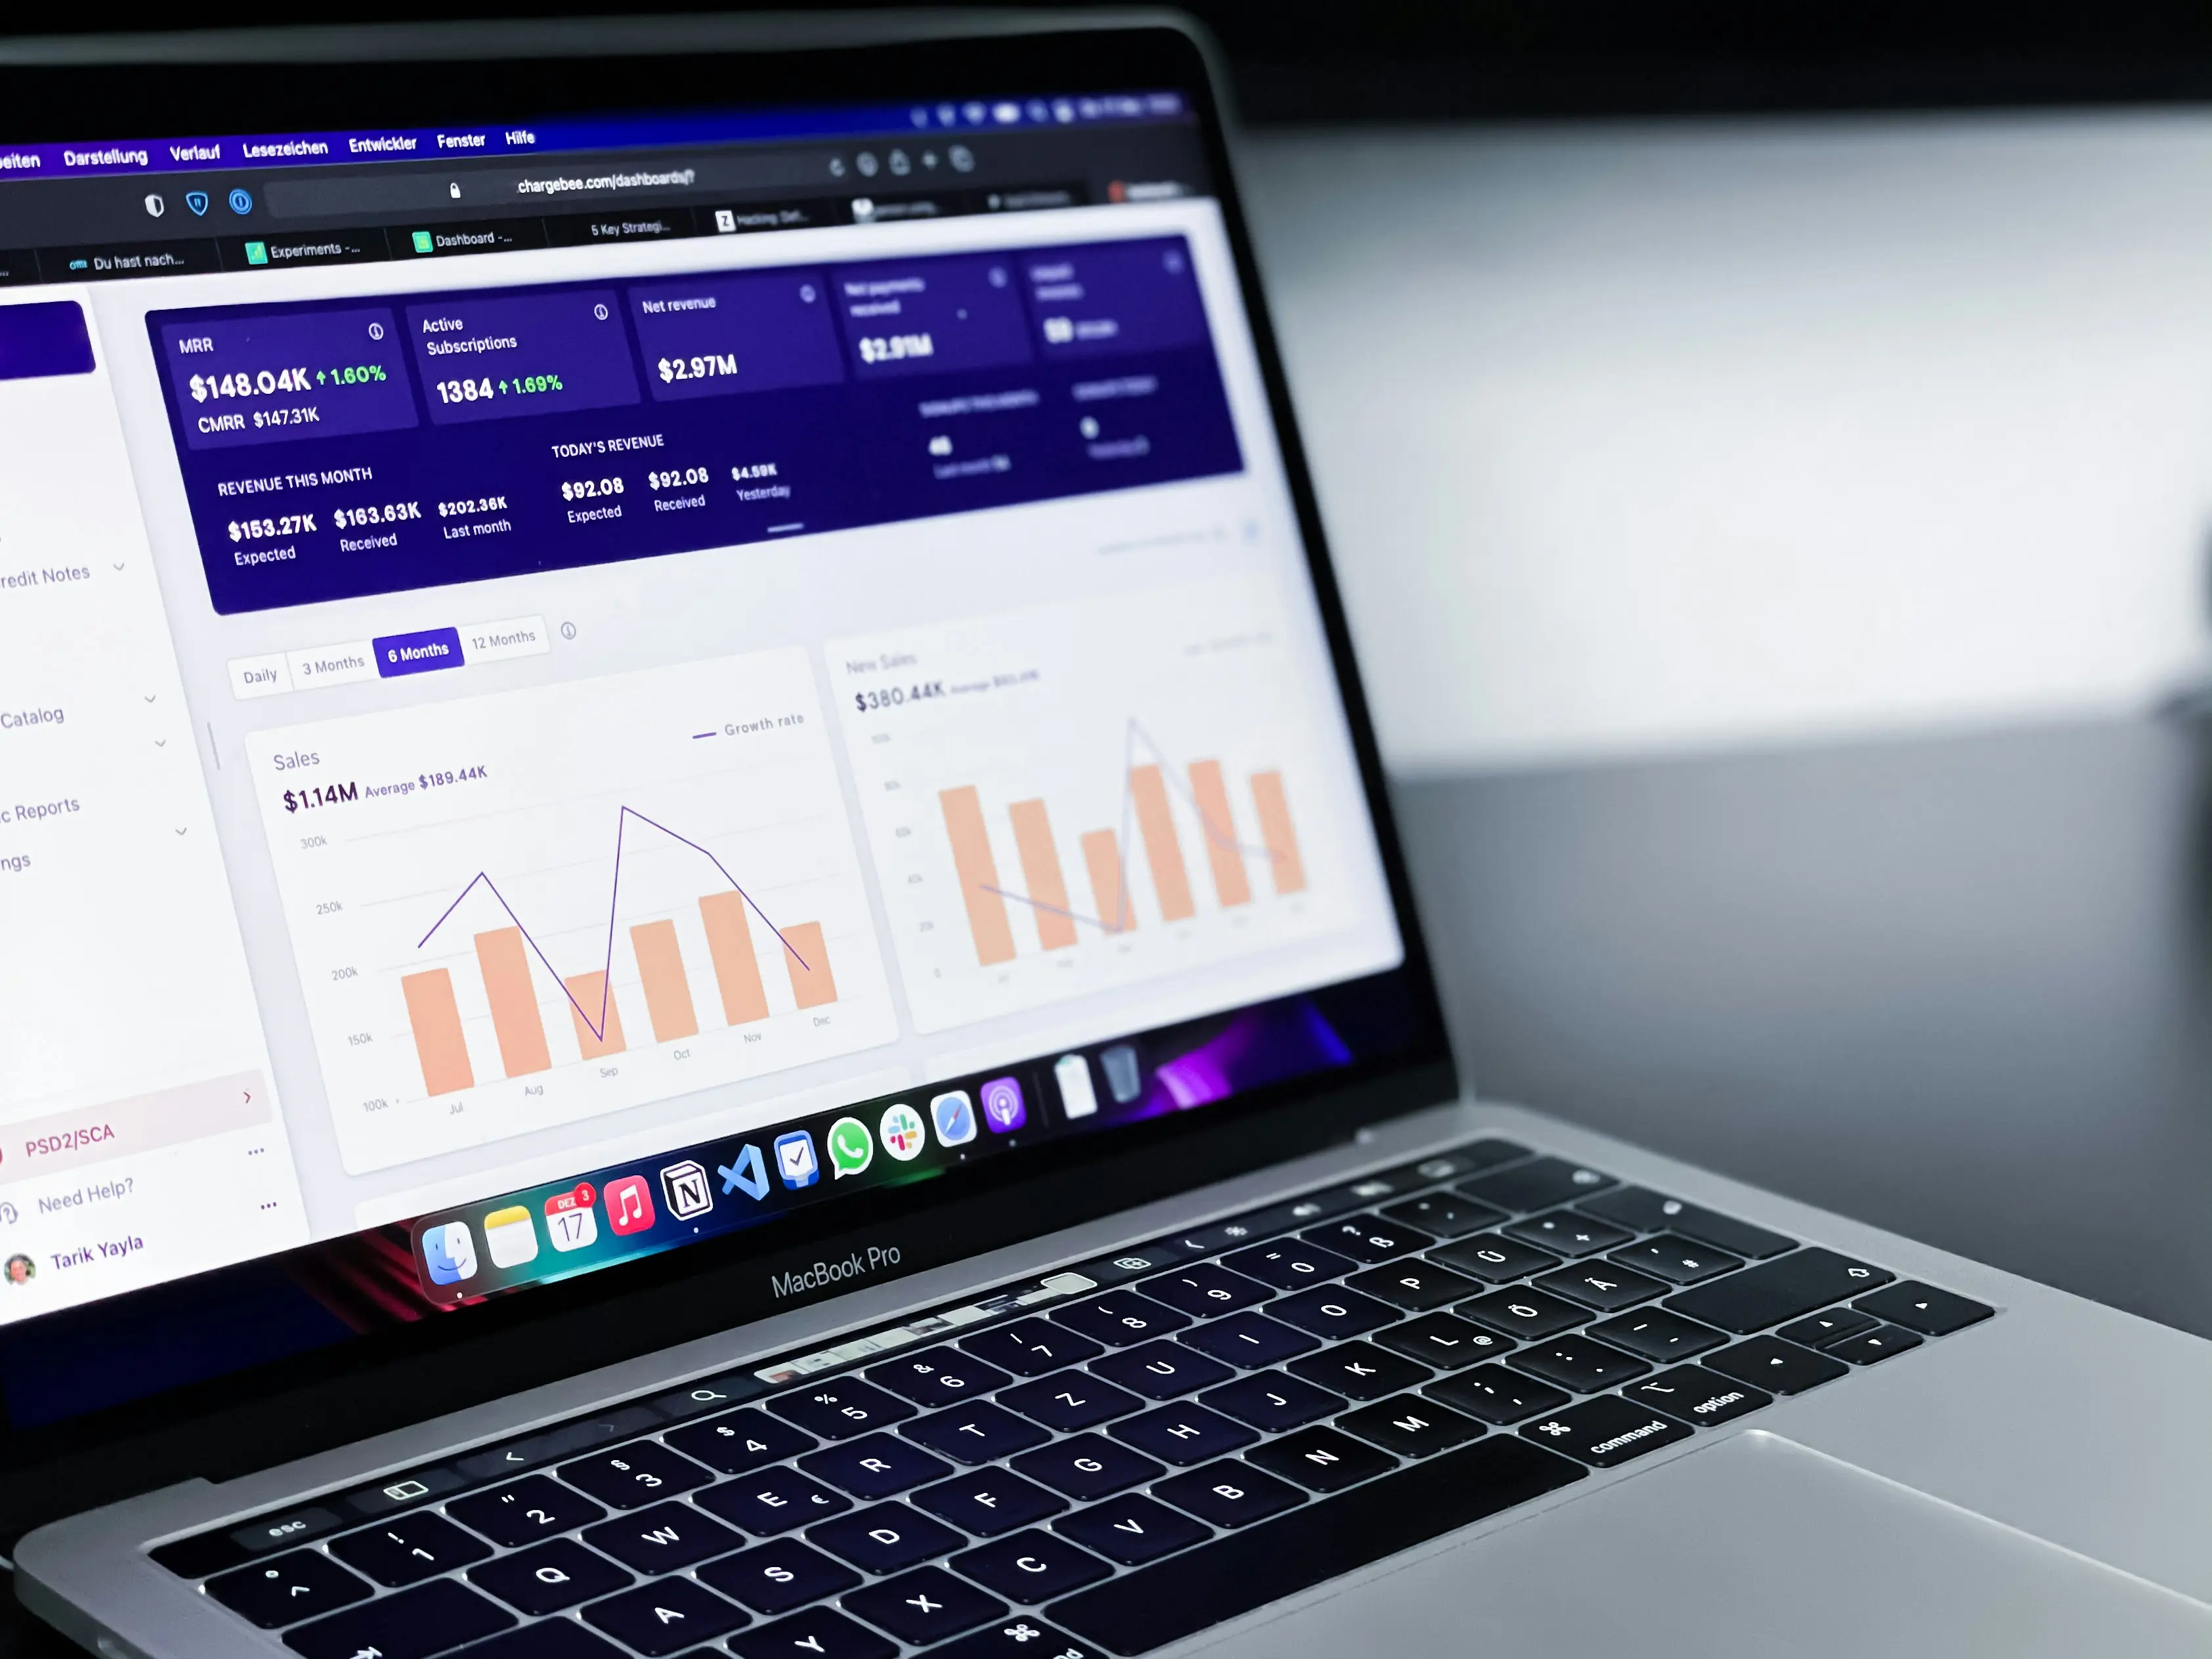
These dashboards typically consist of a few core components working together. You have the data ingestion layer, pulling information from various sources like your CRM, project management tools, or ERP systems. Then comes the AI engine, the brain of the operation, analyzing this data for patterns, anomalies, and predictions. Finally, the visualization layer presents these insights through intuitive charts, graphs, and alerts, making complex information digestible at a glance.
The key difference between this and traditional monitoring lies in the proactive and predictive capabilities offered by AI. While older systems might show you that a bottleneck occurred yesterday, an AI dashboard aims to alert you before it happens or as it's forming. It moves beyond simple reporting to active analysis and recommendation, leveraging machine learning to continuously improve its understanding and suggestions. Common applications span across industries, from optimizing manufacturing production lines and streamlining customer support ticket resolution to managing complex software development cycles and refining marketing campaign workflows.
Benefits of Real-Time Workflow Monitoring
Why embrace this shift towards AI-driven monitoring? The advantages are compelling and address many common operational headaches. Perhaps the most immediate benefit is the instant visibility it provides. No more waiting for end-of-week reports; you see exactly how processes are performing, right now. This transparency alone can be transformative, fostering a culture of awareness and accountability.
Beyond just seeing, AI dashboards enable proactive issue detection and resolution. The AI algorithms are constantly scanning for deviations from the norm, flagging potential problems like resource shortages, task delays, or quality dips often before a human eye would catch them. Imagine catching a potential supply chain disruption hours or days earlier – the impact on preventing downstream chaos is immense. According to insights on operational intelligence, systems that can process and analyze data in real-time, like those discussed by IBM regarding event-driven architecture, are crucial for this kind of proactive stance.
This leads directly to more data-driven decision-making. Gut feelings have their place, but AI provides concrete evidence to back up (or challenge) those instincts. You can confidently allocate resources, adjust priorities, and refine processes based on real-time performance data, not just historical trends or assumptions. This naturally flows into better resource optimization – ensuring the right people and tools are focused on the right tasks at the right time – and ultimately, significant cost reduction by catching inefficiencies and problems early before they escalate.
Essential Components of AI Dashboard Setup
Alright, you're seeing the potential. But how do these dashboards actually come together? It starts, as always, with data.
A. Data Collection
The foundation of any effective AI dashboard is robust data collection. You first need to identify the key metrics that truly reflect the health and efficiency of your workflow. Are you tracking task completion times, error rates, resource utilization, customer satisfaction scores, or something else? Be specific and focus on metrics that drive actionable insights.
Once you know what to measure, you need to set up the data sources. This involves connecting the dashboard platform to the various systems where your workflow data resides – your project management software, CRM, databases, IoT sensors, etc. Ensuring seamless integration with existing systems is crucial; the goal is to create a unified view without requiring manual data entry, which is prone to errors and delays. The quality and timeliness of this data feed directly impact the AI's analytical power.
Think about the granularity needed. Do you need data updated every minute, every hour, or daily? The requirements will depend on the specific workflow's speed and criticality. Setting up reliable, automated data pipelines is non-negotiable for real-time monitoring.
B. Visualization Elements
Data is useless if you can't understand it. That's where visualization comes in. AI dashboards use various elements to present complex information clearly and concisely. Real-time charts and graphs (like line charts for trends, bar charts for comparisons, and pie charts for proportions) are standard, dynamically updating as new data flows in.
Beyond static charts, custom alerts and notifications are vital. These can be configured to trigger when specific thresholds are breached (e.g., task queue exceeds 20 items) or when the AI detects an anomaly. This pushes critical information to the relevant people immediately, prompting timely action. Key Performance Indicators (KPIs) should be prominently displayed, often with color-coding (green, yellow, red) to indicate status at a glance.
Finally, effective dashboards include trend analysis displays. These visualizations help users understand performance over time, identify recurring patterns, and see the impact of changes made to the workflow. The goal is to move beyond snapshots to a deeper understanding of process dynamics, powered by the AI's ability to surface subtle correlations and predict future trajectories.
Implementation Guide
Ready to build your own AI-powered command center? Implementing an AI dashboard requires careful planning and execution. Let's walk through the typical phases.
A. Planning Phase
Before you even think about tools, start with strategy. Clearly define your monitoring objectives. What specific problems are you trying to solve? Are you focused on reducing lead times, improving quality, cutting costs, or enhancing team productivity? Your goals will dictate the metrics you track and the features you need.
Next comes selecting the appropriate tools. There's a growing market of AI dashboard platforms, ranging from general business intelligence tools with AI add-ons to specialized workflow monitoring solutions. Consider factors like ease of use, integration capabilities, AI features (predictive analytics, anomaly detection), customization options, and, of course, budget. We'll touch on some popular tools later in the Popular AI Dashboard Tools and Platforms section.
Don't forget the people! Identify the key stakeholders who will use the dashboard and benefit from its insights. This includes managers, team leads, and even front-line employees. Involving them early ensures the dashboard meets their needs and helps secure buy-in for adoption later on.
B. Setup Process
With a solid plan, you can move to the setup. This usually involves a step-by-step dashboard configuration process within your chosen tool. You'll connect your data sources, define your KPIs, and start building the visualizations – dragging and dropping charts, setting up alerts, and arranging the layout.
A critical step is integration with your core workflow platforms. This might involve using pre-built connectors or APIs to ensure data flows smoothly and automatically. You'll also need to set up the AI analysis parameters, guiding the algorithms on what patterns to look for, what constitutes an anomaly, and how sensitive the alerts should be. This often requires some initial tuning based on your specific processes.
Finally, rigorous testing and validation are essential before rolling it out. Run test data, simulate different scenarios (like sudden spikes or dips), and verify that the dashboard accurately reflects reality and that the AI insights are meaningful. Get feedback from your pilot group of stakeholders and iterate based on their input.
Best Practices for Dashboard Optimization
Launching your dashboard isn't the end; it's the beginning of an ongoing optimization process. To ensure your AI dashboard remains a valuable asset, follow these best practices. First and foremost, continuously evaluate and set meaningful KPIs. Are the metrics you chose initially still the most relevant? Do they truly drive the desired behaviors and outcomes? Don't be afraid to refine them as your understanding evolves.
Recognize that different users have different needs. Customize views and dashboards for specific roles or teams. A manager might need a high-level overview of multiple workflows, while a team lead needs granular detail on their specific process. Personalization increases relevance and adoption. Industry reports often highlight that user adoption rates for new technologies can be significantly improved when the tools are tailored to specific user needs, sometimes increasing adoption by over 20%.
AI models aren't static; they learn, but they also need maintenance. Regular calibration and updates are crucial. Periodically review the AI's performance, retrain models with new data, and adjust alert thresholds to minimize false positives or negatives. Also, never overlook data security considerations. Ensure robust access controls, data encryption, and compliance with privacy regulations, especially when dealing with sensitive workflow information. Finally, invest in user training and adoption strategies. Show users how to interpret the data, leverage the AI insights, and integrate the dashboard into their daily routines.
Popular AI Dashboard Tools and Platforms
Navigating the landscape of AI dashboard tools can be daunting. While the market is constantly evolving, several leading solutions consistently stand out. Platforms like Tableau and Power BI are incorporating more AI features, offering predictive analytics and natural language queries alongside their powerful BI capabilities. Then there are more specialized tools designed explicitly for process monitoring and optimization, which might offer deeper workflow-specific AI models.
When comparing options, look closely at their features and capabilities relevant to your needs, as discussed in the Essential Components of AI Dashboard Setup section. How sophisticated are their AI algorithms? Do they offer anomaly detection, root cause analysis, or predictive forecasting? Equally important are their integration possibilities. Check for native connectors to the workflow automation tools, CRMs, and databases you already use (like Salesforce, Jira, SAP, etc.). Seamless integration saves significant time and effort.
Naturally, pricing considerations play a role. Models vary widely, from per-user licenses to usage-based pricing or tiered subscriptions based on features and data volume. Ensure you understand the total cost of ownership, including potential setup, integration, and training costs. It's often wise to start with a free trial or pilot project to evaluate a tool's fit before making a large commitment.
Advanced Features and Capabilities
Beyond basic real-time monitoring, the true power of AI dashboards lies in their advanced capabilities. Predictive analytics is a game-changer, allowing the system to forecast future workflow states based on current trends and historical data. Imagine knowing the likelihood of meeting a deadline before it's actually at risk, giving you time to intervene proactively.
Anomaly detection goes beyond simple threshold alerts. AI algorithms can identify unusual patterns or outliers that might indicate subtle problems, even if no predefined rule is broken. This helps catch novel or unexpected issues that might otherwise go unnoticed until they cause significant disruption. Some platforms even offer automated optimization suggestions, analyzing the workflow data and recommending specific changes, like reallocating resources or adjusting task sequences, to improve efficiency.
The beauty of machine learning adaptability is that these systems get smarter over time. As they process more data from your specific workflows, their predictions become more accurate, and their understanding of your operational nuances deepens. Furthermore, advanced custom reporting options allow you to tailor outputs precisely, generating detailed analyses for specific investigations or high-level summaries for executive briefings, moving far beyond standard templates.
Common Challenges and Solutions
While the benefits are clear, implementing AI dashboards isn't without its hurdles. One common challenge is ensuring data accuracy and consistency. If the input data from various sources is flawed or inconsistent (the classic "garbage in, garbage out" problem), the AI's insights will be unreliable. The solution lies in robust data governance practices, data cleansing processes, and careful validation of data sources during setup.
Integration complexities can also arise, especially when connecting with legacy systems or highly customized platforms. Using tools with strong API capabilities, employing middleware solutions, or seeking expert integration support can help overcome these technical barriers. Don't underestimate user adoption barriers either. Resistance to change, lack of understanding, or perceived complexity can hinder usage. Comprehensive training, clear communication of benefits, involving users early (as mentioned in the Planning Phase), and demonstrating value through pilot projects are key mitigation strategies.
Optimizing the performance of the dashboard itself, especially with large data volumes, can be tricky. This requires careful database tuning, efficient query design, and potentially scaling up infrastructure. Finally, have troubleshooting tips and support resources readily available. Document common issues, establish clear support channels, and empower users to resolve minor problems themselves.
Future Trends in AI Workflow Monitoring
The field of AI workflow monitoring is rapidly evolving, and the future looks even more integrated and intelligent. We're seeing the rise of emerging technologies like explainable AI (XAI), which aims to make the AI's reasoning more transparent, building trust and facilitating better decision-making. Hyperautomation, the combination of AI, RPA, and other automation tools, will likely lead to dashboards that not only monitor but also trigger automated corrective actions within workflows.
Expected developments include more sophisticated predictive and prescriptive analytics, capable of not just forecasting issues but recommending complex, multi-step solutions. We can also anticipate tighter integration with collaborative tools, allowing teams to discuss insights and coordinate actions directly within the dashboard interface. Industry predictions suggest a move towards more autonomous optimization, where AI agents actively fine-tune workflows in real-time based on performance data, requiring less human intervention for routine adjustments.
How can you prepare for this future? Focus on building a strong data foundation now. Foster a culture of data literacy and continuous improvement within your organization. Stay informed about emerging AI capabilities and be willing to experiment with new tools and approaches. The businesses that embrace these advancements proactively will be best positioned to thrive in an increasingly automated and data-driven world.
Case Studies
Let's make this more concrete. While specific client details are often confidential, I've seen firsthand how AI dashboards drive real results. Consider a logistics company I worked with; they were constantly battling unpredictable delivery delays. By implementing an AI dashboard that monitored driver locations, traffic patterns, vehicle diagnostics, and delivery queues in real-time, they gained unprecedented visibility. The AI's anomaly detection quickly flagged potential issues, like a truck idling too long or a route becoming congested, allowing dispatchers to intervene proactively. The result? A 15% reduction in late deliveries within six months and significantly improved customer satisfaction – a clear demonstration of ROI.
Another example comes from a software development team struggling with inconsistent sprint velocity and bug resolution times. Their AI dashboard integrated data from Jira, GitHub, and testing tools. The predictive analytics feature started forecasting potential sprint overloads based on task complexity and historical performance, enabling better planning. Trend analysis highlighted recurring bottlenecks in the code review process. Addressing these insights led to a 20% increase in feature deployment frequency and a noticeable drop in critical bugs reaching production.
The key lesson learned across these implementations is the importance of starting with clear objectives and involving the end-users throughout the process, as emphasized in our Implementation Guide. Technology is only part of the equation; aligning it with business goals and empowering people to use it effectively is what truly unlocks its potential. These success stories aren't magic; they're the result of strategic implementation and a commitment to data-driven improvement.
Conclusion
Whew, we've covered a lot of ground! From understanding the core concepts of AI-powered workflow dashboards to exploring their benefits, components, implementation steps, and advanced features, I hope you now have a clearer picture of their transformative potential. We've seen how moving beyond traditional monitoring to embrace real-time, AI-driven insights provides instant visibility, enables proactive problem-solving, and supports smarter, data-backed decisions. Remember the logistics company and the dev team? Those aren't isolated incidents; they represent the tangible impact these tools can have.
Yes, there are challenges like data integration and user adoption, but as we discussed in the Common Challenges and Solutions section, these are solvable with careful planning and execution. The key is to start strategically, focus on meaningful KPIs, choose the right tools, and invest in your people. The future points towards even more intelligent and autonomous systems, making now the perfect time to build your foundation.
So, what are your next steps? Start by identifying one or two critical workflows in your own operations that could benefit most from enhanced visibility and optimization. Begin defining those key metrics we talked about in the Data Collection section. Explore some of the Popular AI Dashboard Tools and Platforms and see which might align with your needs and existing tech stack. Don't aim for perfection immediately; start small, iterate, and build momentum.


